


Published October 30, 2025
by Stephen Brayton
• Updated June 07, 2026
Annualized Failure Rate: A Maintenance Metric That Matters
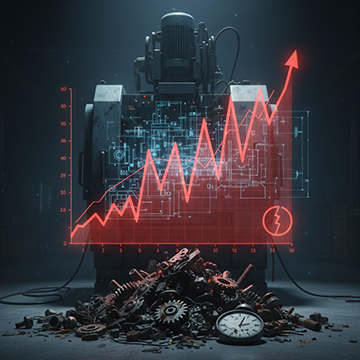 Annualized Failure Rate (AFR) is a maintenance metric that matters. It offers maintenance teams a clear gauge of equipment reliability in a given year. This article explains AFR in fresh terms, shows how to compute and interpret it, and illustrates how CMMS software can unlock its value. Real-world examples from manufacturing, data centers, and fleet services bring the concept to life. Expect deeper insight into how tracking AFR drives smart maintenance decisions.
What the Annualized Failure Rate Measures and Why It Matters
Annualized Failure Rate calculates the percentage of units or components likely to fail over a one-year operating period. In equipment upkeep, that figure reveals how reliable assets remain in service. One way to express it:
How to Calculate AFR and Interpret Equipment Reliability
AFR = (Failures in Year ÷ Total Units or Operating Hours) × 100
Thus, if 1,000 identical units experience 25 failures in a year, their AFR is 2.5 percent.
AFR and MTBF are closely related—knowing one helps you understand the other. For example, if a device has a Mean Time Between Failures (MTBF) of 40 years, that means it's expected to fail once every 40 years on average. This translates to an Annualized Failure Rate (AFR) of about 2.5%.
In industries like electronics and server hardware, manufacturers often provide MTBF values. You can estimate AFR from those numbers using this formula:
AFR ≈ 8766 ÷ MTBF (in hours)
(Note: 8766 is the number of hours in a year, accounting for leap years.)
Why talk in decades (like 40 years)?
Sometimes, manufacturers of very reliable equipment—especially in electronics or server hardware—measure Mean Time Between Failures (MTBF) in hours. But because those numbers get so large, it helps to put them in terms of years just to understand them.
- An MTBF of 350,000 hours sounds abstract.
- But if you divide that by 8,766 hours in a year, it equals about 40 years.
That doesn’t mean the device will actually last 40 years without failing. It means if you had 1,000 identical devices running, you'd expect about 25 to fail in one year—which equals an AFR of 2.5%.
So how do MTBF and AFR connect?
You can estimate one from the other using this simple formula:
AFR (%) = (8,766 ÷ MTBF in hours) × 100
Example:
- If MTBF = 350,000 hours:
AFR = (8,766 ÷ 350,000) × 100 ≈ 2.5%
So, industries talk about “decades” because very reliable components have very high MTBF values, and expressing them in years just makes them easier to understand.
Industry Applications of AFR in Maintenance Metrics
Manufacturing and Industrial Equipment
In factories, equipment downtime translates directly into lost production. Operators track AFR across pumps, motors, conveyors. If AFR jumps from 5 percent to 8 percent year-over-year, that signals potential root-cause issues or aging assets.
Data Centers and IT Operations
Data centers rely on servers, storage arrays, and network gear built with known MTBF values. When hard drives carry an AFR near 2 or 3 percent, operators will spawn spare parts, plan replacement cycles, and schedule backups accordingly.
Fleet Services and Vehicles
Businesses that maintain vehicle fleets track AFR of components such as engines, transmissions, and suspensions. For example, if a specific brake system shows AFR over 10 percent, managers might modify preventive maintenance plans or source alternative parts. In safety-critical use like aviation or fleet logistics, low AFR supports regulatory compliance and cost control.
Calculating and Interpreting AFR
Simple Count Method:
AFR = (Total Failures ÷ Total Units) × 100, where "Total Units" reflects those deployed during the year. That yields the percentage likely to fail in one year.
Time-Based Method:
For systems that operate continuously, AFR = (Total Failures ÷ Total Operating Hours) × 8,760 hours for a full year. That method fits industrial machines or always-running equipment. If MTBF is known, AFR approximates 8766 ÷ MTBF under exponential life-distribution assumptions.
Interpreting results depends on context:
- AFR under 0.1 percent means near-zero failure risk—critical in aerospace, healthcare, or data integrity use cases.
- AFR between 1 and 5 percent reflects moderate reliability; failures remain predictable and manageable.
- AFR above 10 percent raises issues: frequent breakdowns, rising repair costs, and potential reputational damage.
How a CMMS Helps Track and Act on AFR
Centralizing Data and Work Orders
 A CMMS logs all work orders, failure events, and operating hours for assets. That system automatically computes AFR per asset type or fleet class. Teams avoid manual spreadsheets and reduce errors.
Benchmarking and Trend Analysis
Once tracked over multiple periods, AFR trends become clear. A CMMS can visualize AFR rising on older assets, signaling ideal replacement cycles. Benchmarks—such as average AFR for similar machines or industry norms—show where assets underperform.
Guiding Preventive or Predictive Efforts
When AFR climbs beyond acceptable targets, maintenance leaders can shift to more frequent condition checks or sensor monitoring. In manufacturing plants deploying predictive maintenance, failure forecasting tools rely on AFR and MTBF data to support model training and alerts. Even those who use a system that does not tie into sensors can still record equipment readings for better PMs.
Optimizing Spare Parts Inventory
Knowing which items exhibit higher AFR lets teams stock the correct spare parts. High-AFR assets may carry more replacement units on hand. A CMMS tracks spare parts usage and allows supervisors to input reorder levels based on failure rates.
Cross-industry Example: Hospital Equipment
In a healthcare facility, medical imaging devices like MRI or CT scanners may show AFR under 0.5 percent. However, peripheral devices—such as cooling pumps or power supplies—might fail more often. A CMMS tracks failure history by component. If the AFR spiked on one manufacturer’s pump module, the hospital can switch suppliers and reduce downtime significantly.
Manufacturing Example: Robotics Line
An automated plant used robotic welders whose motors failed at 3 percent AFR. After integrating vibration sensors and logging hourly usage in their CMMS, planners instituted meter-based maintenance. AFR dropped by nearly half over the next year. CMMS generated reports that drove technician staffing, spare parts purchasing, and equipment warranties.
Common AFR Pitfalls and How Maintenance Teams Can Avoid Them
AFR simplifies many failure counts into a single percentage, but it can mislead under certain assumptions:
- It assumes uniform operating time across units. When usage varies, simple unit-based AFR may distort comparisons.
- It reflects average probability—not individual performance. Rare early failures or ‘infant mortality’ skew averages.
- Extrapolating AFR into precise future reliability predictions can misfire without considering age-specific failure patterns or the bathtub curve.
A CMMS stores age-cohort data, failure timestamps, and operating hours. That rich dataset supports deeper analysis—such as actuarial projections, hazard rates, and Remaining Useful Life forecasts. Maintenance teams avoid over-reliance on simplistic AFR models.
Summary Table of AFR Ranges and Implications
| AFR Range | Reliability Level | Typical Response |
|---|---|---|
| < 0.1 % | Very high reliability | Minimal maintenance; critical systems |
| 1–5 % | Moderate reliability | Routine preventive tasks; redundancy acceptable |
| > 5–10 % | Rising concern | Review root causes; strengthen monitoring |
| > 10 % | Poor reliability | Immediate action; possible replacement |
CMMS reports can surface these categories by equipment class or site location, helping management allocate resources effectively.
AI-Enhanced Reliability and the Role of Predictive Maintenance
In smart manufacturing environments, forecasting failures with machine learning depends on historical data like AFR, MTBF, and sensor inputs. A CMMS, with proper input data, can provide the needed reports for better maintenance and productivity. Such systems extend useful life, minimize unplanned downtime, and reshape maintenance from reactive to predictive.
Why AFR Is One of the Most Valuable Maintenance Metrics
Annualized Failure Rate provides more than a number. When anchored in reliable data and supported by CMMS analytics, AFR exposes equipment weaknesses, guides maintenance investments, and shapes smarter asset life-cycle choices. Tracking AFR helps maintenance teams stay proactive, spot aging patterns, and reduce unexpected failures. In effect, AFR becomes a tool for continuous improvement rather than a stagnant statistic.
FAQs
What is Annualized Failure Rate (AFR) and why is it important?
Annualized Failure Rate (AFR) measures the percentage of equipment expected to fail in a year, helping maintenance teams gauge reliability and plan preventive actions.
How do AFR and MTBF relate to each other?
AFR and MTBF are inversely connected; AFR can be estimated by dividing annual operating hours by MTBF, giving insight into expected failures over time.
How can CMMS software help track AFR?
CMMS systems like MAPCON centralize failure events, work orders, and operating hours, automatically calculating AFR to support maintenance planning.
What AFR ranges indicate high or low equipment reliability?
AFR under 0.1% signals very high reliability, 1–5% is moderate, 5–10% indicates rising concern, and above 10% requires immediate action.
How is AFR used in different industries?
Industries such as manufacturing, data centers, and fleet management use AFR to monitor critical equipment, optimize preventive maintenance, and manage spare parts inventory.
Can AFR predict individual equipment failures?
AFR reflects average failure probability; for precise predictions, detailed data from a CMMS like MAPCON can analyze trends, operating hours, and component age.
MAPCON | 800-922-4336
Try Our CMMS Software Today!
MAPCON CMMS software empowers you to plan and execute PM tasks flawlessly, thanks to its wealth of features and customizable options. Want to see it for yourself? Click the button below to get your FREE 30-day trial of MAPCON!